Dashboard
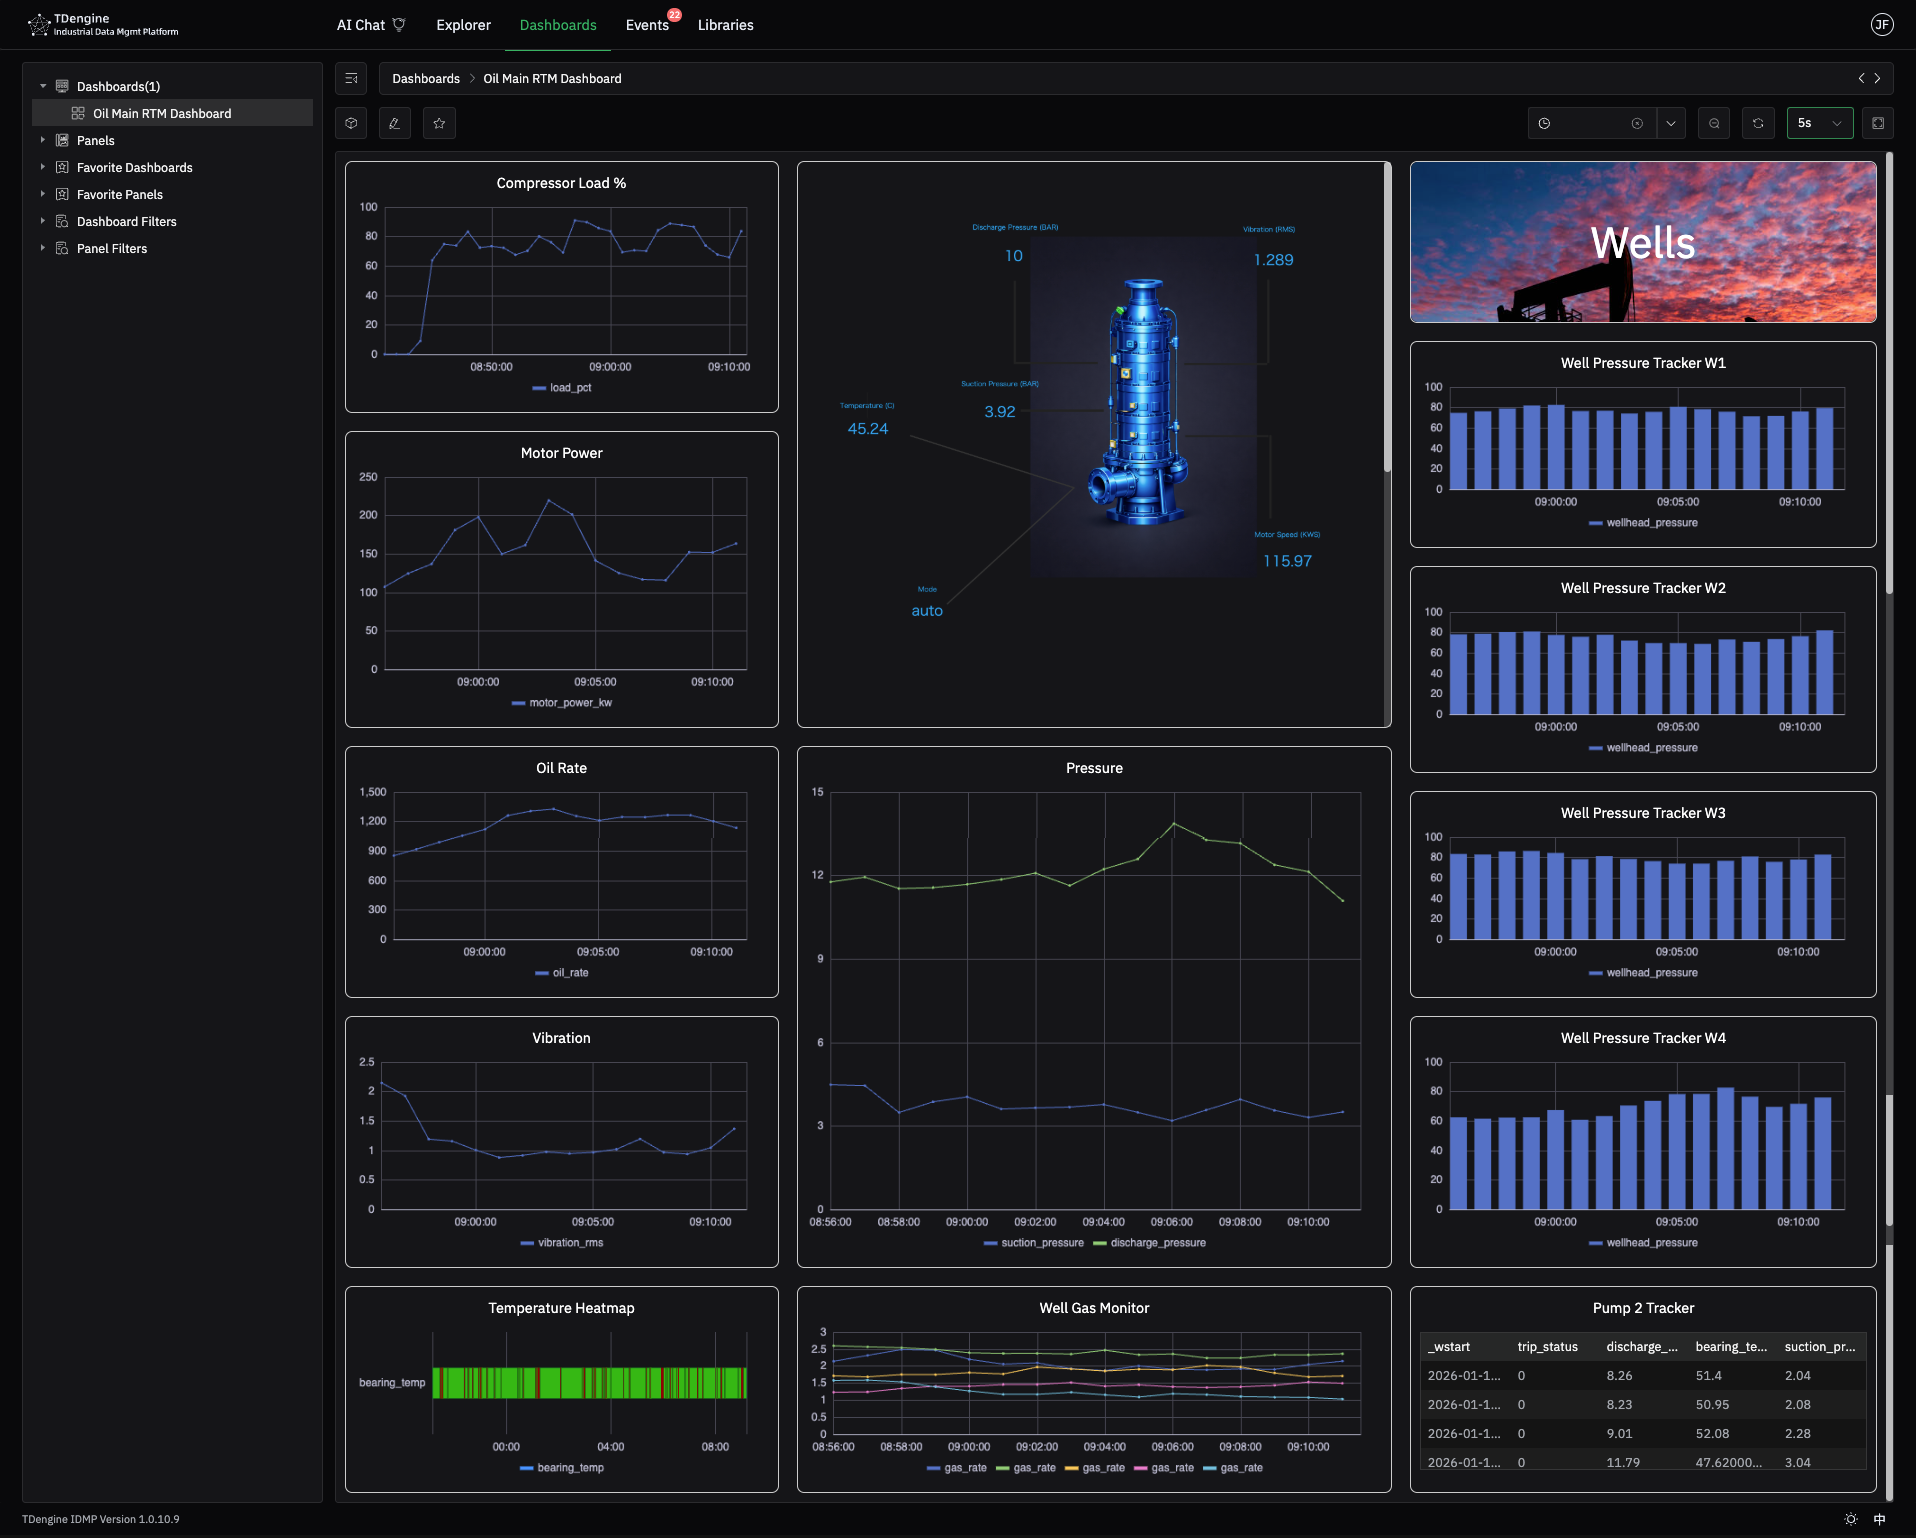
Dashboards are used to comprehensively display multiple charts and data, helping users quickly understand the overall situation. Below is an example of a dashboard for a drilling platform:
Create a Dashboard
-
In the "Element Browser" feature, select an element from the element tree on the left, then click the "Dashboard" menu to enter the dashboard list page. Click the "+" button in the upper right corner of the page to enter the dashboard editing page.
-
In the "Base Library" feature, click to select a template under "Element Templates" in the left navigation bar, such as "Smart Meter", then click "Dashboard Templates" to enter the dashboard template list page. Click the "+" button in the upper right corner of the page to enter the dashboard template editing page.
Edit a Dashboard
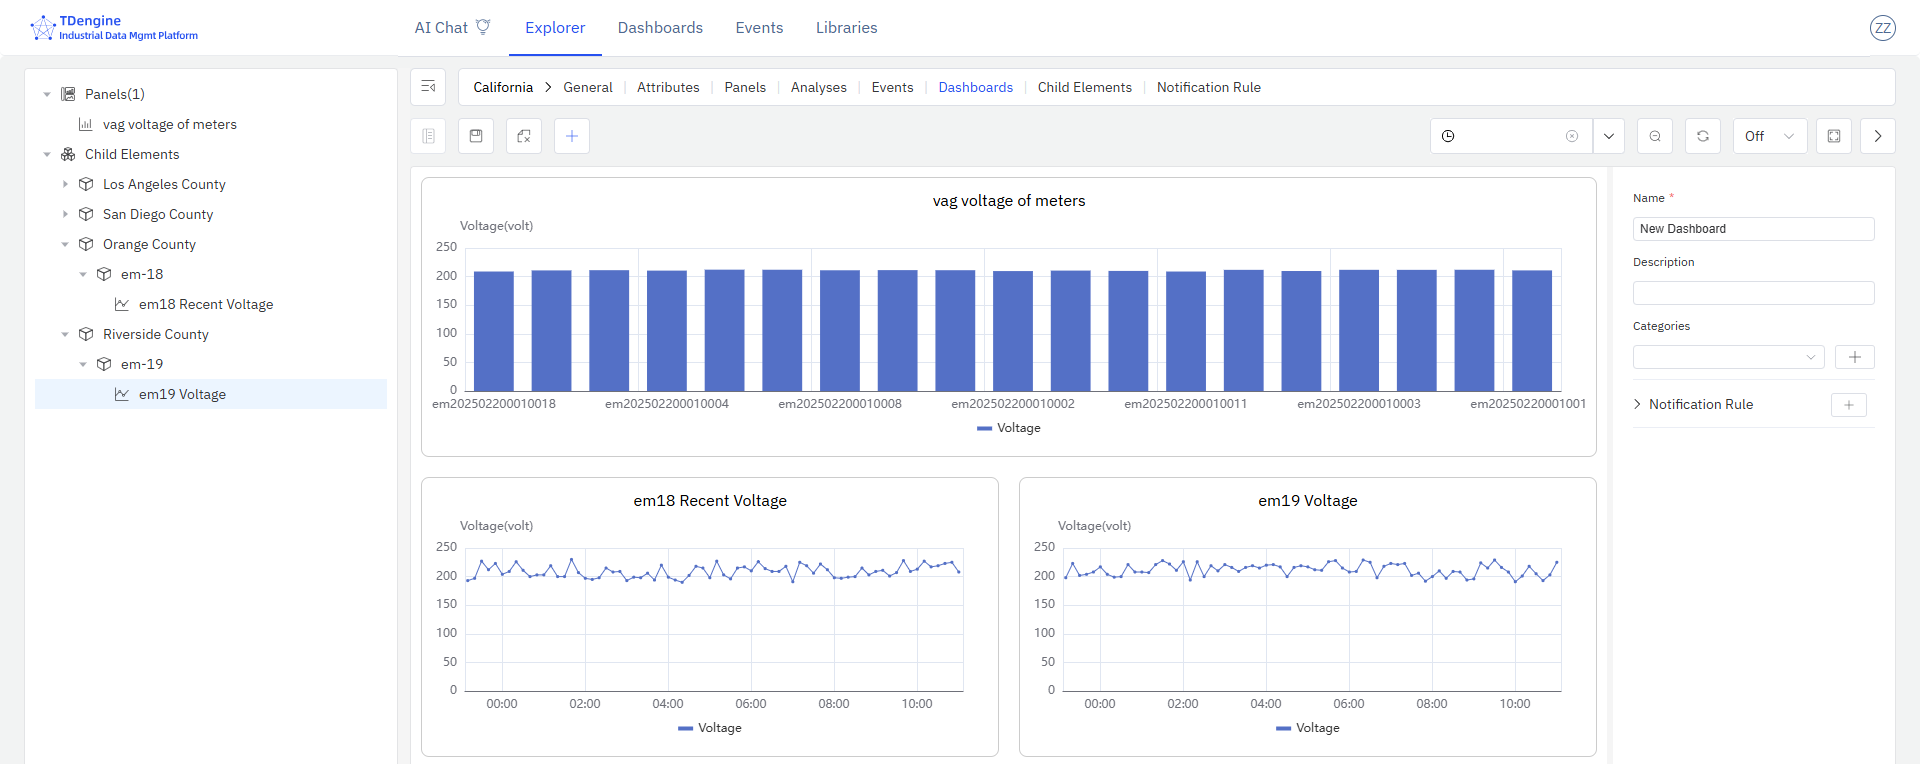
As shown in the figure, you can perform editing operations on the dashboard. On the left is the list of panels to choose from, and the middle grid area is the panel layout of the current dashboard. You can drag and drop panels from the left to the dashboard on the right; you can also drag and drop existing panels to reorder and adjust the layout. When the mouse hovers over a panel, delete and edit buttons will appear. Clicking the edit button opens a new editing interface for the panel. After saving, you return to the current dashboard editing page.
The time range selector is located in the upper right corner of the dashboard. You can select different time ranges to view data for the corresponding time periods. The time range selection only affects panels with dynamically changing time ranges. If a panel is configured with a fixed time range, it is not affected by the dashboard's time range selector.
The basic information form on the right side of the dashboard allows you to enter the dashboard name and description. You can set notification rules to periodically send dashboard snapshots to specified users. For detailed configuration methods, please refer to the Dashboard and Panel Notifications section.
Save a Dashboard
After editing, click the save button in the upper right corner of the page to save the current dashboard.
View a Dashboard
On the dashboard list page, click the name of a dashboard to view its content. On the dashboard view page, you can click the share button in the upper right corner to generate a shareable link for the dashboard. This link can be shared with others and supports opening directly in a browser or embedding in third-party pages.
