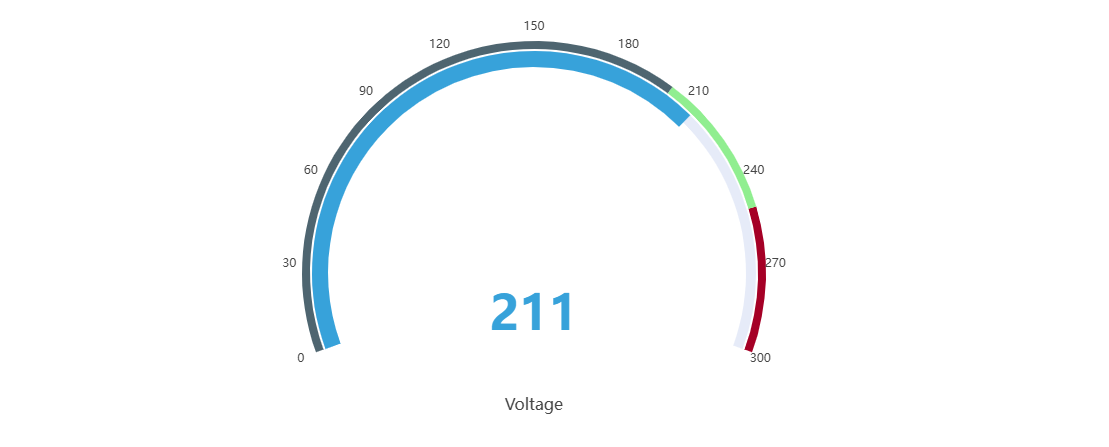
Gauge Chart
A gauge chart is used for real-time data monitoring. It can display different warning zones on the panel, facilitating quick judgment of the current status.
Configuration
Graph Configuration
Orientation
When there are multiple gauges in a single panel, you can specify the priority direction for the gauges to be sorted and displayed. Both vertical and horizontal sorting directions are supported, with horizontal as the default.
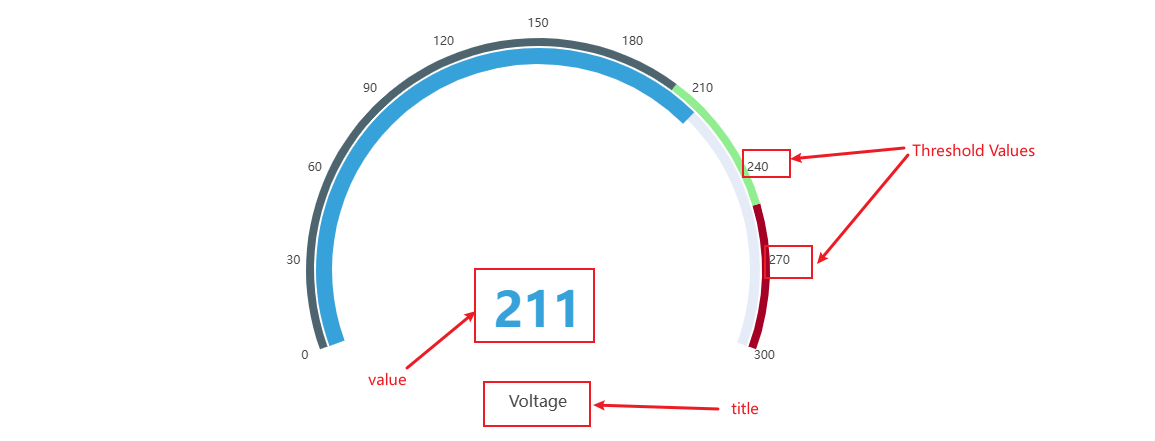
Threshold Label
You can configure whether to display the threshold label, which is not shown by default.
Title and Font Size
You can configure whether to display the title and its font size.
Value Text Size
You can configure the value font size.
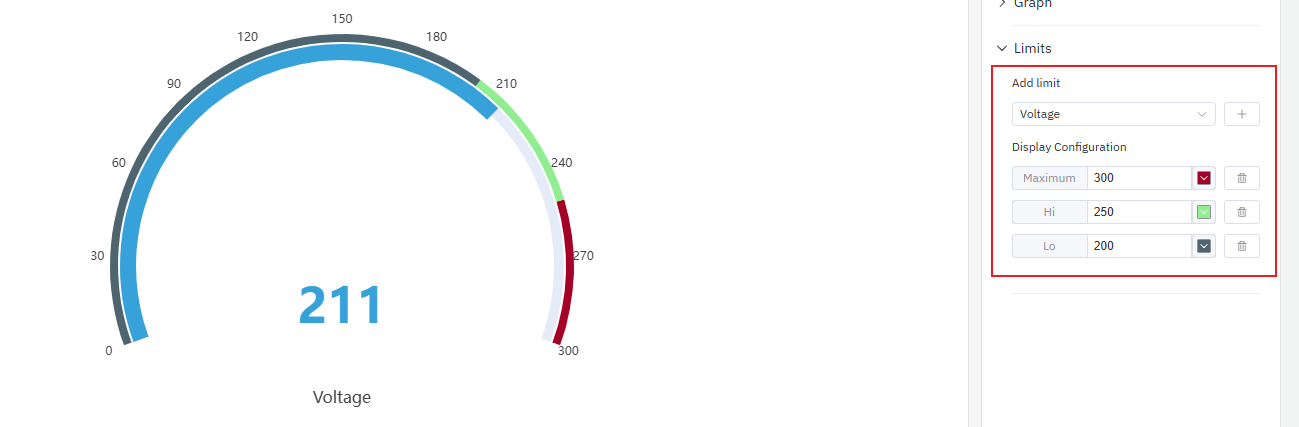
Limits
By configuring boundary values, different zones can be divided on the dashboard, allowing for quick visual distinction of the current monitoring status.
Roadmap
To continuously enhance your user experience, we will keep adding practical configurations in subsequent product updates, allowing you to enjoy richer and more user-friendly analysis features.
| Configuration | Description |
|---|---|
| Gauge Theme | You can configure richer styles, such as displaying it as a donut chart or a pie chart. |
| Max/Min | Set the maximum and minimum values |
