2.4 Experiencing IDMP Features
After activating TDengine IDMP, follow the steps in this section to familiarize yourself with the interface and explore the key features of the system.
2.4.1 UI Tour Guide
The Tour Guide opens automatically on your first login. It walks you through the main areas of the IDMP interface. Click Next to proceed through each step. You can close it at any time by clicking X. To restart the tour later, click your avatar in the top right and select Tour Guide.
The interface is organized into the following areas:
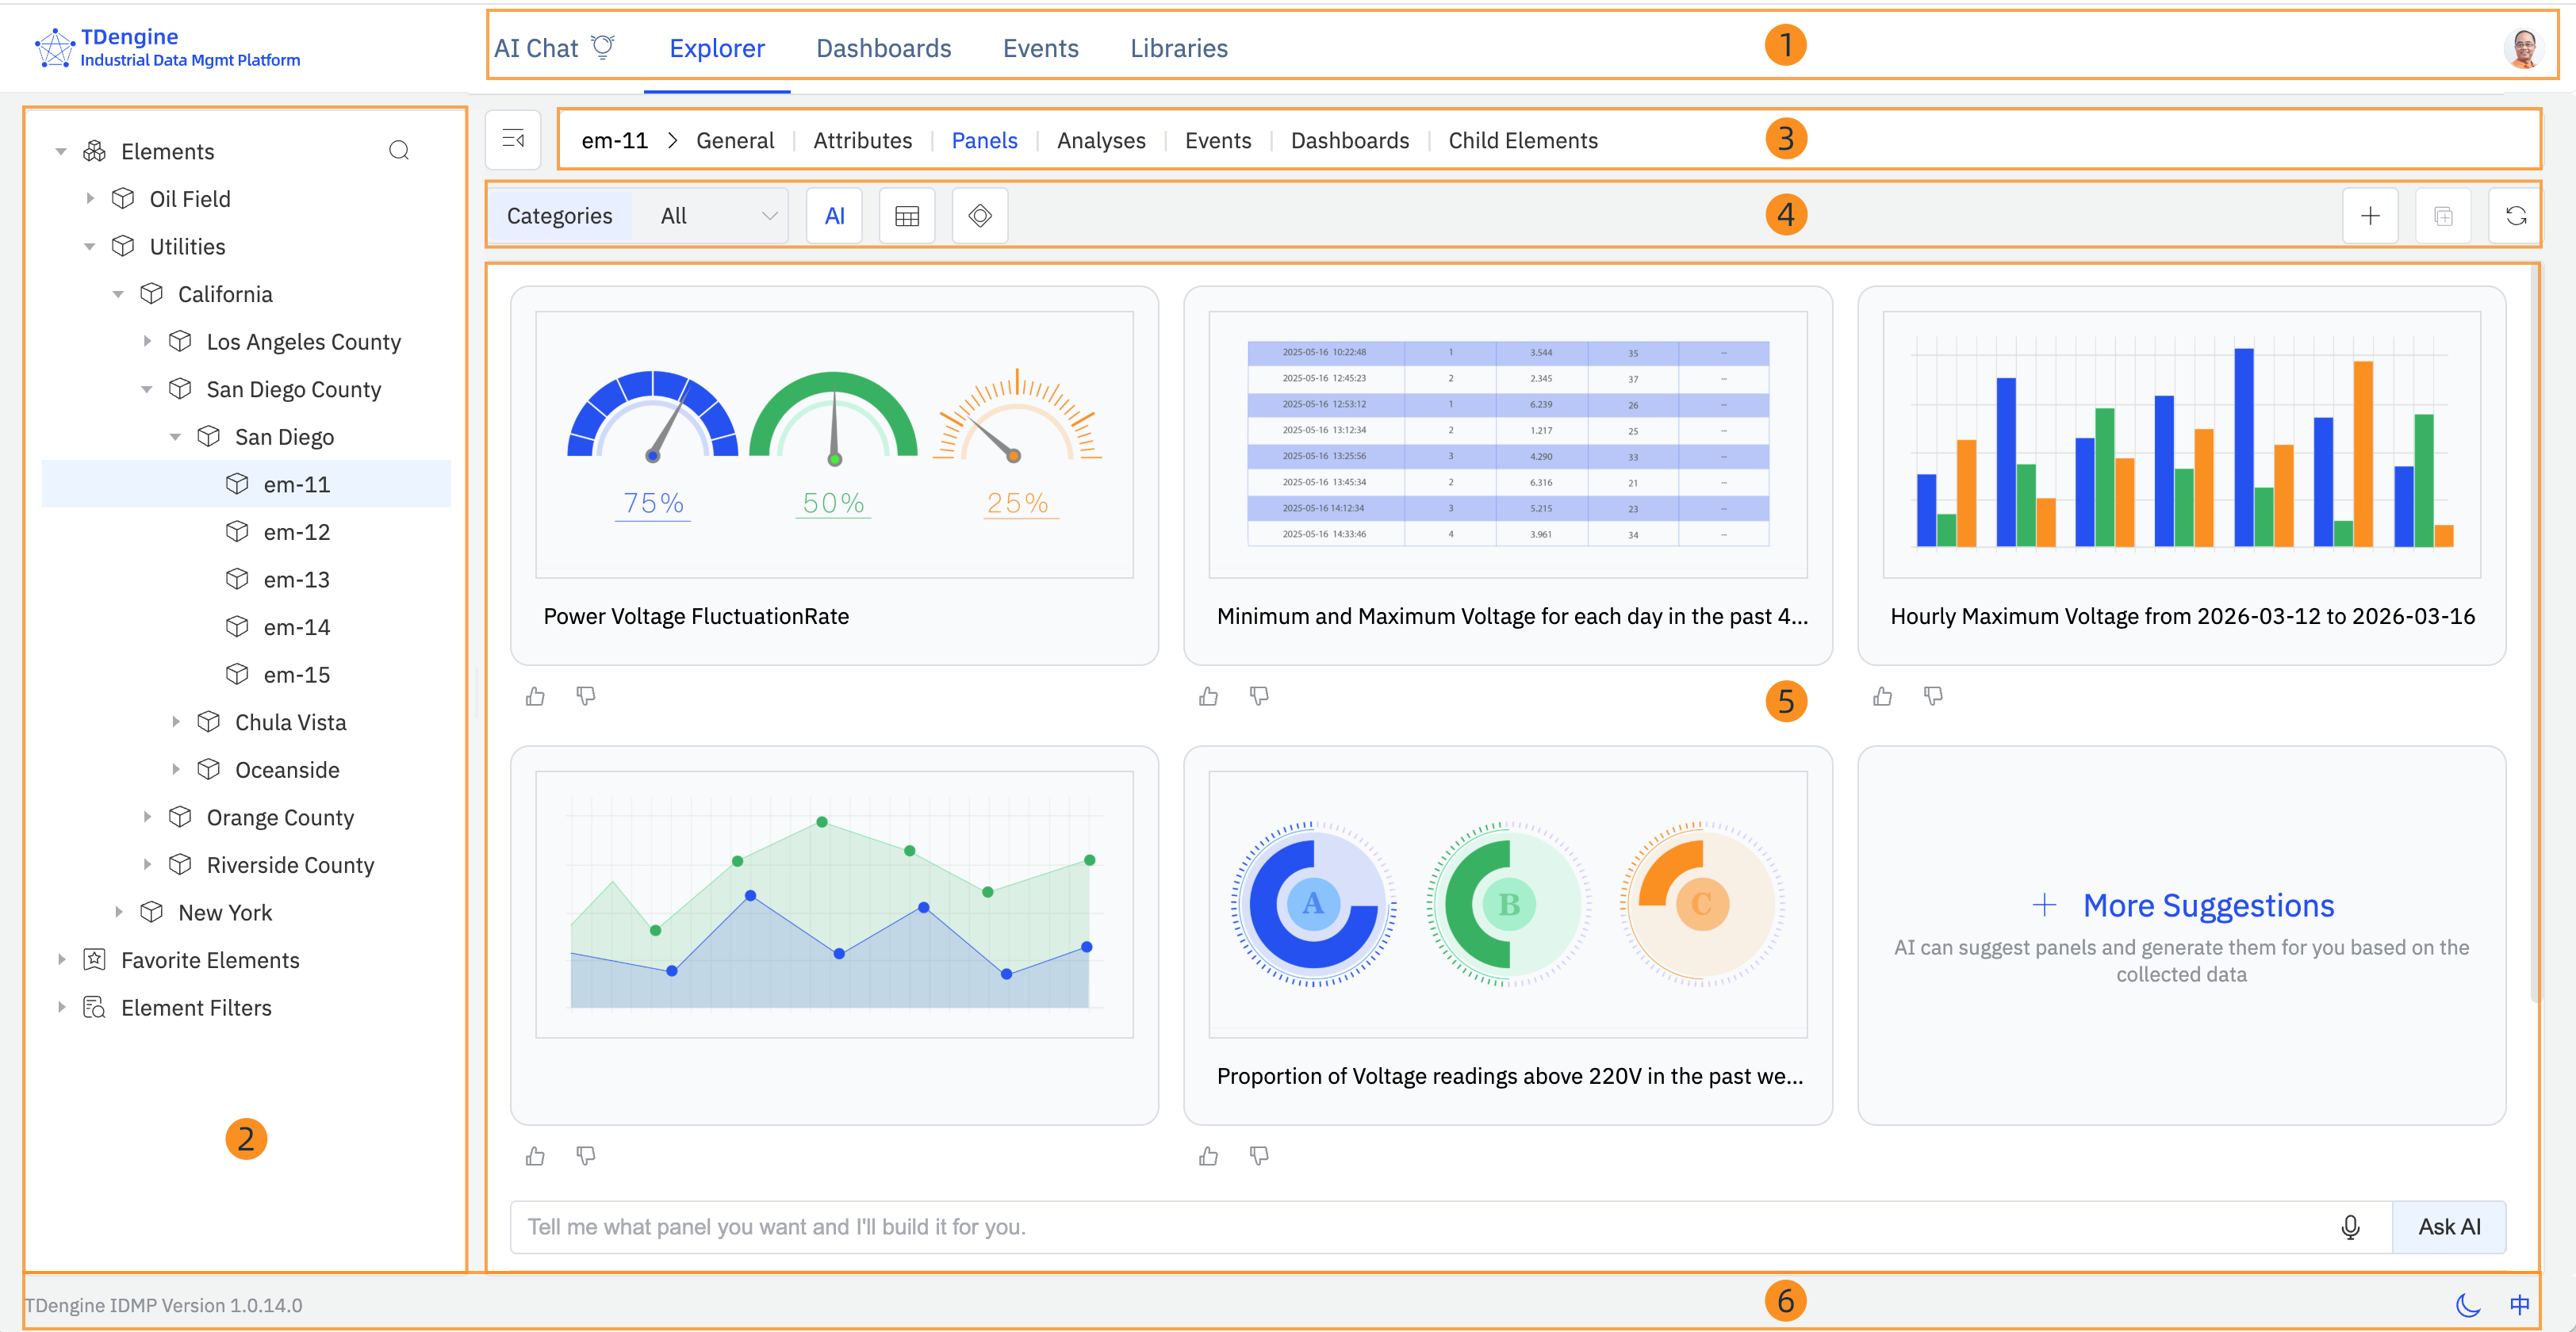
1. Top Navigation Bar
The top navigation bar spans the full width of the page. On the left is the TDengine logo. In the center are the five main modules:
- AI Chat — Ask questions about your industrial data in natural language.
- Explorer — Browse and manage your asset hierarchy, attributes, panels, analyses, and events.
- Dashboards — View and manage dashboards across all elements.
- Events — Browse, filter, and analyze events across the system.
- Libraries — Manage shared resources such as element templates, event templates, enumerations, units of measure, and more.
On the far right is your avatar. Click it to manage your profile, access system administration, or launch the Tour Guide.
2. Left Panel
The left panel shows the tree structure for the active module. In the Explorer, it displays three sections:
- Elements — The asset hierarchy. Click the arrow to expand a node; click the element name to select it. Use the search icon to find elements by name.
- Favorite Elements — Elements you have marked as favorites for quick access.
- Element Filters — Saved search filters that let you quickly recall a specific set of elements.
3. Context Tab Bar
The context tab bar appears to the right of the left panel. It shows the name of the currently selected object, followed by a set of tabs representing the available views for that object. When an element is selected, the tabs are: General, Attributes, Panels, Analyses, Events, Dashboards, and Child Elements. Click a tab to switch views. On the far left of the context tab bar is a collapse icon to hide the left panel and maximize the workspace.
The built-in Tour Guide refers to this area as the "Path Bar".
4. Action Bar
Below the context tab bar is a row of controls. The left side typically shows filter dropdowns (such as Categories) and view toggle buttons (such as the AI suggestions button or grid/list view). The right side shows action icons including + to add a new item and a refresh button.
5. Main Workspace
The main area below the action bar displays the content for the currently selected tab — element details, attribute lists, panels, events, and so on. Content can be viewed and edited directly in this area.
6. Status Bar
The status bar runs along the bottom of the page. The left side shows the current IDMP version. The right side has a theme toggle (light/dark mode) and a language toggle.
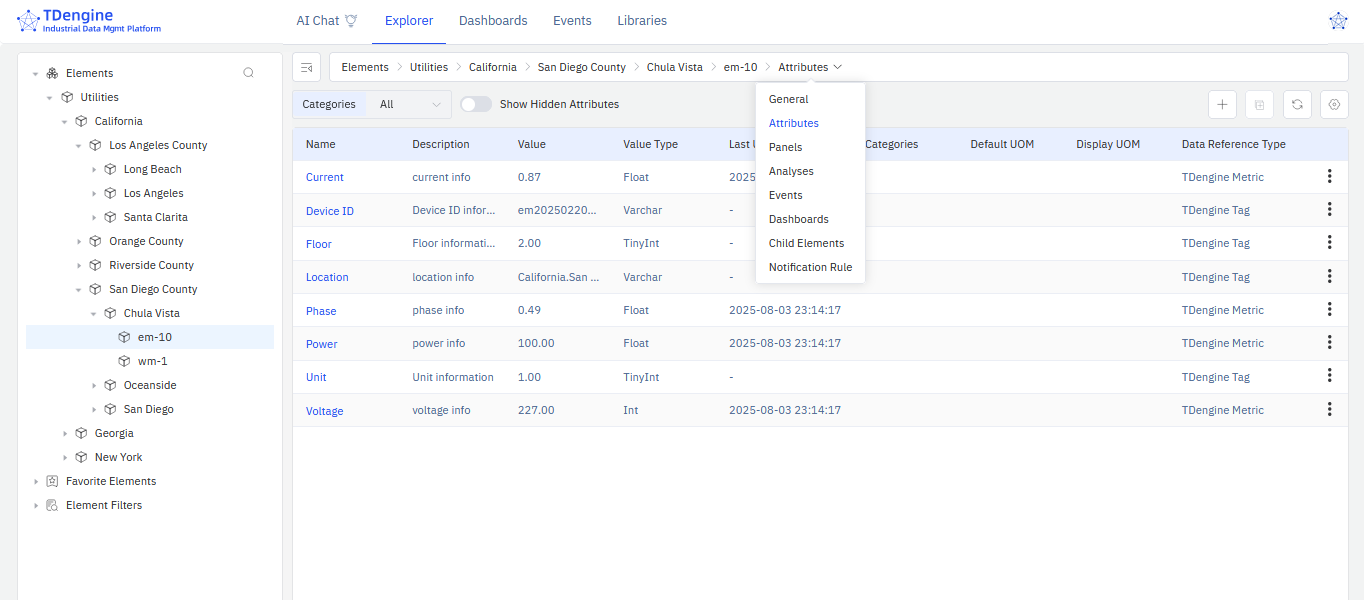
2.4.2 View Element Information
The following steps use the Utilities scenario as an example. If you did not load it during activation, go to Admin Console > Sample Data and load it before continuing.
- In the left panel, click Elements. The elements in the Utilities scenario appear in a tree hierarchy.
- Select Utilities > California > San Diego County > Chula Vista > em-10. This element represents electricity meter number 10 in Chula Vista, California.
- In the context tab bar, select General to view the description and basic information about this meter.
- Select Attributes to view its attributes, such as current and voltage.
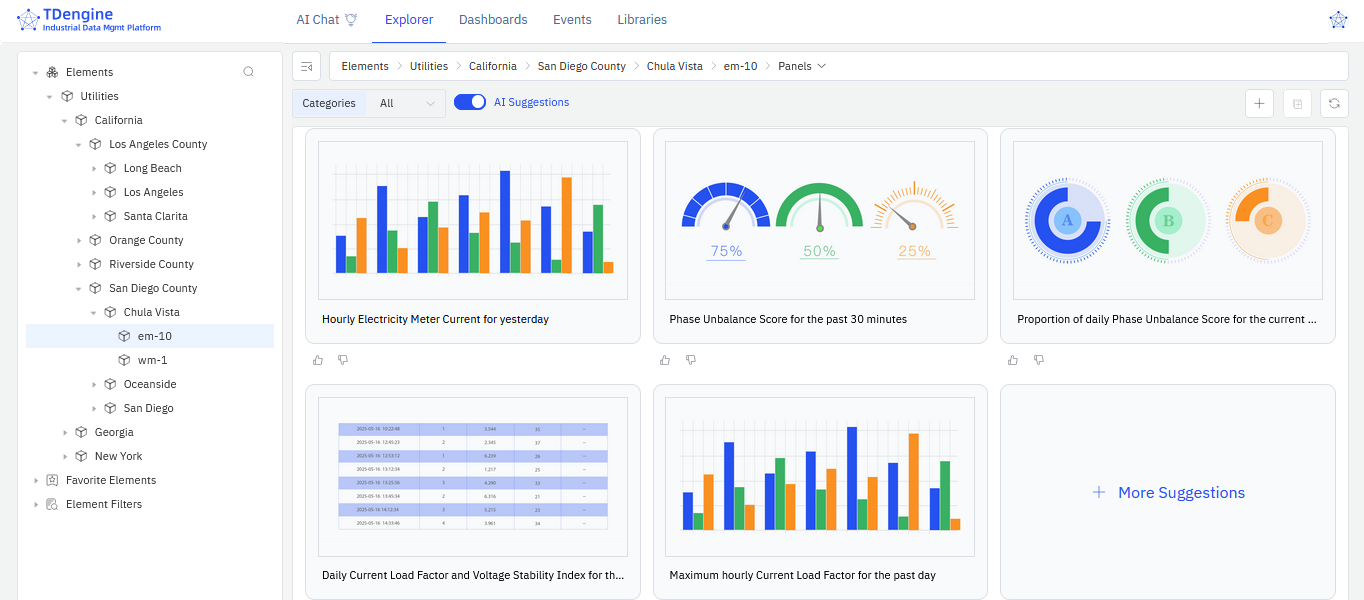
2.4.3 Try AI-Generated Panels
-
Select the element Utilities > California > San Diego County > Chula Vista > em-10.
-
In the context tab bar, select Panels. Five AI-recommended panels are displayed. Click + More Suggestions to generate additional options.
-
You can also request a panel in natural language using the input box below the recommendations. For example:
"Show a line chart of the voltage and current changes every minute for electricity meter em-10 over the past 24 hours."
Click Ask AI to generate the panel.
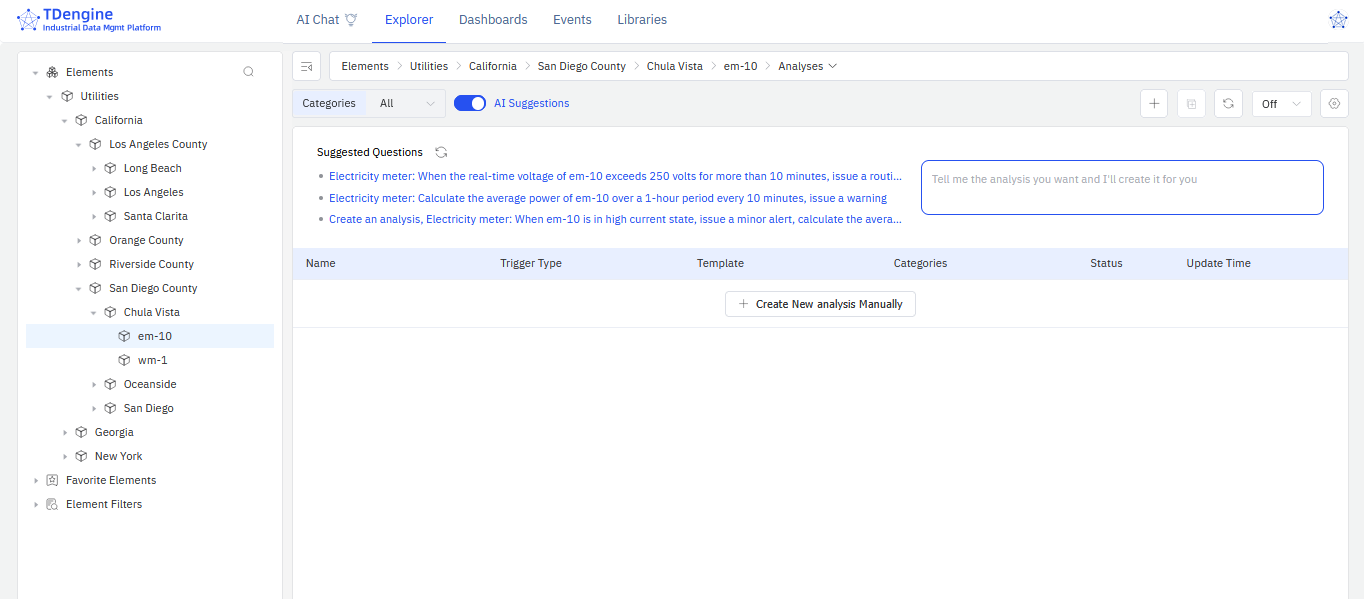
2.4.4 Try AI-Powered Analysis
-
Select the element Utilities > California > San Diego County > Chula Vista > em-10.
-
In the context tab bar, select Analyses. Three AI-recommended questions are displayed.
-
Click a suggestion link to open the analysis creation page, where you can review and adjust the AI-generated configuration. Click Save to complete the setup.
-
You can also describe an analysis in natural language using the input box next to the recommendations. For example:
"If power fluctuation for electricity meter em-10 exceeds plus or minus 20% for 30 minutes, generate a 'warning' level alert and calculate the fluctuation range."
Press Enter to generate the analysis.
2.4.5 Next Steps
You have explored the IDMP interface and tried AI-generated panels and analyses. From here, you can:
- Proceed to Chapter 3 to learn how to build your own asset model with elements and attributes.
- Proceed to Chapter 12 to connect your own data sources and ingest real industrial data.
- Load additional sample scenarios to explore more industry use cases. Click your avatar in the top right, select Admin Console, and then click Sample Data in the left panel.
