4.2.11 Event List
Overview
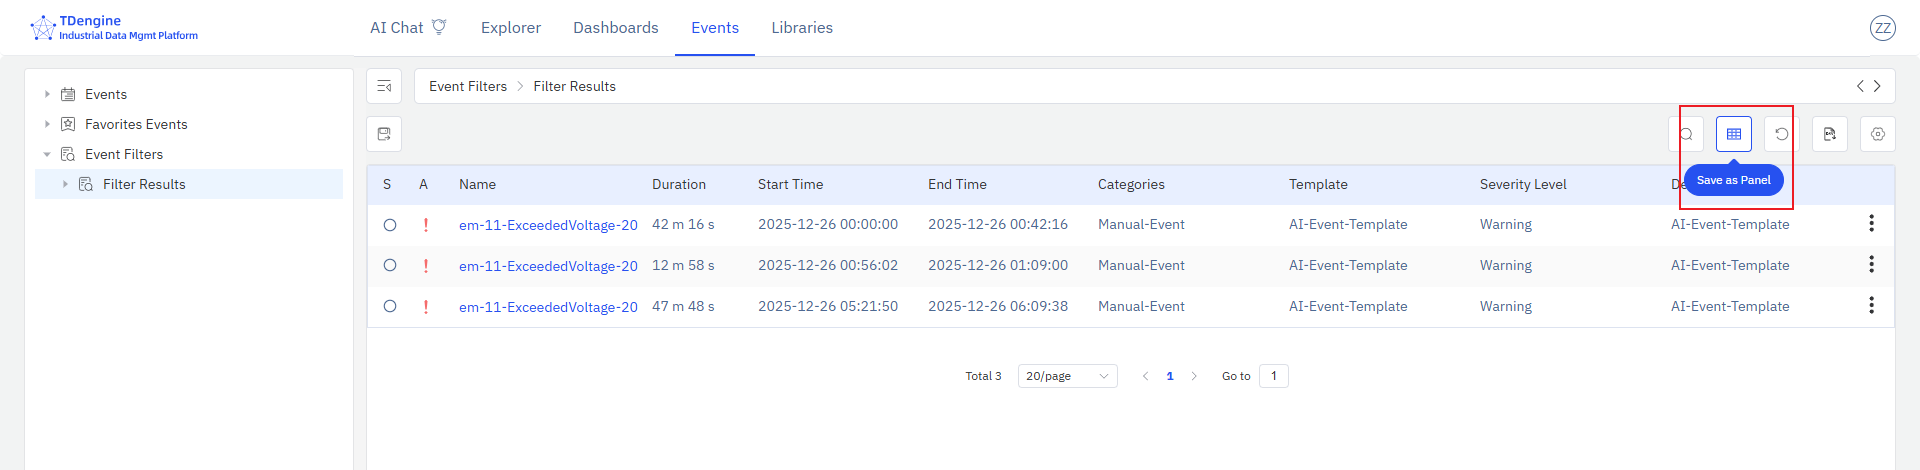
The Event List panel displays events in a tabular grid, showing severity, acknowledgment status, name, duration, start and end times, and other event metadata. It is created by saving a filtered view from the Events section, and can be placed on an element's panel list or added to a dashboard.
When to Use
Use the Event List panel when:
- You want to surface a filtered event view — such as active alarms for a specific area — directly on a dashboard
- You need to monitor events for a group of assets alongside other operational panels
- You want operations or maintenance teams to see relevant events in context without navigating to the Events view
Configuration
Saving an Event List Panel
Navigate to the Events main menu and click Event Filter in the left panel. Configure the filter conditions to scope the events you want to track. Click Save as Panel to save the current filtered event list as an Event List panel.
After saving, the panel preview opens automatically. You can also navigate to the target element's Panels tab to view the new Event List panel.
Example Scenarios
Area event monitor. A maintenance team lead saves an Event List filtered to alarms for Production Area B and places it on the area dashboard. Operators see the current alarm list in context alongside the trend panels for the area, without switching to the Events view.
Shift handover events. An operations manager saves an Event List scoped to the past 24 hours for a production line and pins it to the shift handover dashboard. Both incoming and outgoing shifts see the same filtered event history at the start of every shift.
Critical-severity watch. A plant manager saves an Event List filtered to critical-severity events across the entire site and adds it to the plant overview dashboard. The panel gives immediate visibility into any critical conditions regardless of which area they occur in.
